Understanding LiDAR
Introduction
I first started exploring LiDAR among various other sensors in 2020 for a Virtana client that was looking for a robust way to detect power lines in various environmental conditions. This blog serves to introduce you to LiDAR and to some of the important factors that may affect whether you want to use LiDAR for your project or not. The covered topics include laser wavelength, types of LiDAR, the output of LiDAR devices as well as the limitations of LiDAR.
What is LiDAR?
LiDAR is an acronym for Light Detection and Ranging or Laser Imaging, Detection and Ranging. You may also see it referred to as 3D Laser Scanning. It is commonly used to create 3D representations of various environments by measuring the time that it takes for light to travel between the light emitter and its surroundings. Sensors that use this form of distance measurement are referred to as Time of Flight (ToF) sensors.

Figure 1. An image depicting the calculations done for distance with a ToF set-up.
While most LiDAR devices use ToF technology, there are other ToF sensors that are not LiDAR sensors such as sonar or radar. The difference is that LiDAR uses lasers or light. That’s it!
Additionally, there are LiDAR devices that can measure distance and velocity. They measure distance by observing the difference in wavelength or amplitude of the reflected light. These are called Frequency Modulated Continuous Waves (FMCW) LiDAR or Amplitude Modulated Continuous Wave (AMCW) LiDAR respectively.

Figure 2. An image depicting how the change in wavelength is measured by FMCW LiDAR.

Figure 3. An image depicting how the change in amplitude is measured by AMCW LiDAR.
Velocity is measured through the use of Continuous Waves (CW). The returned light is compared to the broadcasted light and the change in frequency is observed. This is known as a doppler shift (a shift in color in our case). Through this, the velocity of the observed object can be measured.
We explore FMCW some more further down in this blog. For more details on ToF vs FMCW, check out this Medium Article.
LiDAR Transmissions
A LiDAR device produces pulsed light from a laser and the reflection of that pulse is received on a sensor. This light can be divergent or focused to a point. Divergent based LiDARs usually produce a beam of light that expands from its laser source to cover a large area while focused point LiDARs use lenses to keep the laser focused to a tiny point even at extreme distances. All scanning LiDARs need to use a focused point.
Laser Wavelength
The most popular wavelengths of light used in LiDAR technologies are 860 or 905 nm and 1550 nm. In recent studies, 1550 nm wavelength LiDAR has been found to have several benefits over other wavelengths. These benefits include better eye safety, longer detection ranges and higher accuracy, to name a few. Additionally, since 1550 nm LiDAR is eye safe, it can be operated at higher power levels. Some of the disadvantages include the cost and size of the 1550 nm LiDAR, as well as its worse performance in rainy/snowy weather. Additionally, due to the potential to use more power than 905 nm LiDAR, 1550 nm LiDAR therefore requires more cooling.
Read more in the LSLiDAR Blog and Photonics Report blog. Additionally, this write up on Laser Focus World is also a useful, albeit more technical read.
Output from LiDAR Sensors
If you haven’t used LiDAR before, you may assume that the output from LiDAR sensors will be presented in the form of a depth image where depth values are laid out distinctly in a 2D array. However, this is not the case for most LiDAR sensors (Ouster points out that structured LiDAR data would help make tasks easier further in the data processing pipeline).
With LiDAR, you are presented with a detailed 3D map of the environment. This is usually in the form of a point cloud, which is a list of points in 3D space. This is due to the fact that the LiDAR’s laser is pulsed and recorded for each distinct depth reading. The origin of these points is the location of the device when the scan was taken. Point clouds have various different file type extensions. Occasionally a company may use their own proprietary output format (example on pg 58) that contains extra metadata and structures the data for easy retrieval.
Noisy Data
It’s worth mentioning that, like with most sensors, LiDARs will produce depth readings with varying amounts of noise. Each LiDAR is unique and will state their “noise/accuracy” levels in their datasheets.
Sub-Optimal Lighting/Reflectivity Effects
LiDAR (in general) can give varying data readings depending on the lighting conditions of its environment and the reflectivity of the surface it is detecting. Sunlight will interfere with the depth readings from LiDAR. The datasheets for the sensors that you’ll be looking at often state the specifications for optimal conditions. Real life is rarely, if ever, so optimal. For example, the Intel® RealSense™ LiDAR Camera L515 stated an indoor range of 9m and we were only able to observe 6-8m readings. Additionally, the 1D lidar sensor we used stated a 10m range while our depth readings capped out at 9.5m on specific materials while on 7m for other materials.
Multiple Depth Readings
Some LiDARs can produce multiple depth readings per pulse. This is important, for example, if you would like to produce a map of an environment with and without foliage. Multiple readings/returns may also help see through fog and rain.
3D LiDAR Output
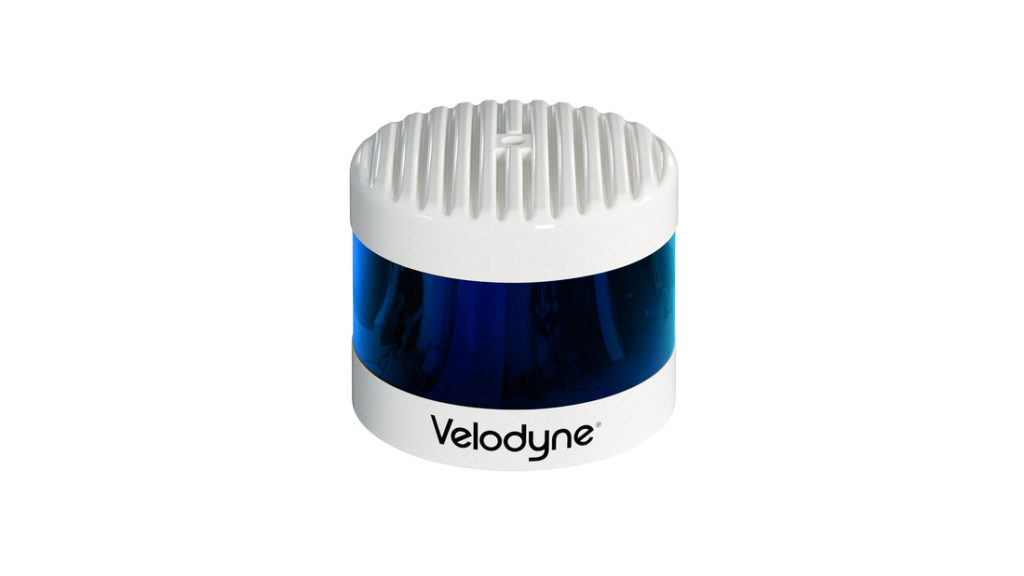

Figure 4. An image of a 3D LiDAR device and an image of its output visualized.
Source: https://velodynelidar.com/blog/velodyne-lidars-alpha-prime-ready-for-prime-time/
3D LiDAR is often used when mapping complex environments in detail. For example, 3D LiDAR is used in applications such as mapping to topological formation of land, to self-driving vehicles and virtual house tours.
For simplicity, you can imagine the output of 3D LiDAR to be similar to the output from an RGB Camera. The main difference is that we have distance values instead of RGB values for each pixel. As mentioned previously, the data may not be arranged in the rectangular shape of a 2D Array or may not be structured at all.
A 3D LiDAR sensor’s output may be represented in a fashion similar to the following:

Figure 5. A snapshot of depth data from the perspective of a Velodyne HDL-64E S2.
From the perspective of the camera, the data will appear as lines filled with dots. We can think of these dots as pixels. From an alternative perspective or with a heat map (blue for far objects, red for close objects), we can see that each of these dots has a range associated with them.
Figure 6. A snapshot of the Velodyne HDL-64E S2 depth data viewed at an alternative angle.
Some LiDAR solutions also capture RGB with an additional RGB camera and apply it by overlaying it on the LiDAR data. Here’s an example of a point cloud from LiDAR USA that can be viewed online at mypointclouds.com.
2D LiDAR Output


Figure 7. An image of a 2D LiDAR sensor and an image of its potential output.
Sources: https://www.sick.com/gb/en/catalog/products/lidar-and-radar-sensors/lidar-sensors/lrs4000/c/g555594
https://www.mdpi.com/1424-8220/23/5/2534
The output from 2D LiDAR can be thought of as a single row of pixels from the 3D LiDAR data. This type of distance measurement is useful for distance sensing on a specific plane. You can think of an automated vacuum that only needs to see objects at its height.
Food for Thought
With a moving 2D LiDAR sensor, you can map a 3D area. The 2D LiDAR sensor can either move laterally (nodding) or rotate but will require additional sensors to map its movements to its sensor data. The Carnegie Multisense SLB did this in combination with a stereo camera to produce depth data.

Figure 8. A short GIF of the Carnegie Multisense SLB in use.
Here’s a short gif of Willow Garage’s PR2 robot using a nodding technique.

Figure 9. A robot navigating an environment using a nodding 2D LiDAR.
1D LiDAR Output
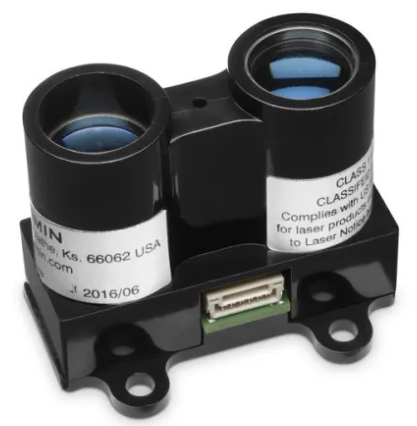
Figure 10. An image of a 1D LiDAR sensor.
The output from a 1D lidar is a single pixel/range reading. These types of sensors are good for presenting you with a distance measurement to a single point. Unlike sonar or radar sensors, the 1D LiDAR sensor is extremely sensitive in the direction it is pointed at. A sonar or radar sensor will return a distance reading from the strongest reflection of its emitted divergent signals (sometimes being as narrow as few degrees of divergence, or as wide as 90 degrees or more) while a 1D LiDAR sensor will produce a distance reading originating from a single point of illumination with a minimal amount of divergence.
Aside: Beam divergence can vary drastically across sensors. For instance, the Garmin LiDAR Lite-V3 has a beam divergence of 0.458 deg, versus the Ouster OS-1’s 0.09 deg. At 40m away, this results in a laser spot of 64cm wide, versus 12.6cm, respectively.
Methods of 3D LiDAR Data Collection
LiDAR devices can be categorized as either Divergent Beam or Scanning (Focused Point) LiDAR. They can also be categorized by whether they are Solid State or Mechanical, whereby mechanical LiDARs contain moving parts and are therefore less reliable. Divergent Beam LiDAR is almost always solid state while scanning LiDAR can be solid state or not, as scanning LiDARs that use Optical Phased Arrays (OPA) to perform the scanning do not require any moving parts.
Divergent vs Focused Point LiDAR
Divergent LiDAR uses a non-focused beam that spreads as it leaves its source to illuminate a large environment
Focused Point LiDAR uses a concentrated light beam that is focused to a single point to measure the range at that point. To measure an environment, this point must be moved for each point that you would like to collect a range reading. This is referred to as scanning. There are a few ways that this scanning takes place in LiDAR devices:
Mechanical Systems
A motor spinning a tilting mirror
Multichannel - A motor spinning many lasers
MEMS (micro-electromechanical system - Quasi-Solid-State)
Optical Phased Arrays (Solid State)

Figure 11. (a) Divergent Beam; (b) Optical Phased Array (OPA); (c) Traditional Scanning LiDAR; (d) MEMS Quasi-Solid-State LiDAR.
Hesai Technology gives a wonderful breakdown of 3D LiDAR in their blog as well.
Divergent Beam LiDAR
Categories: Solid State, Divergent Beam
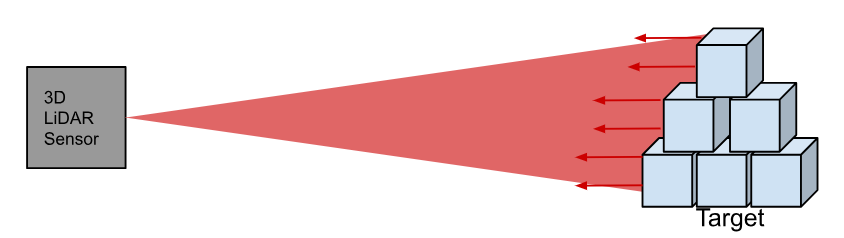
Figure 12. A diagram showing the functionality of a divergent beam LiDAR.
A divergent beam LiDAR sensor uses pulsed lasers to illuminate a broad area within its view. The reflected light from the whole environment is measured all at once on a 2-D sensor array to give us the range readings of the visible environment. Since the light from these sensors originates from a single point and diverges, it follows the Inverse Square Law where the energy required to illuminate the scene is inversely proportional to the distance between the illuminator and its environment. What this implies is that a divergent beam LiDAR will require either significant illumination, a small field of view or a very short pulse time to produce depth readings from further away. Therefore, divergent beam LiDAR usually operates within a limited range. This type of LiDAR uses no moving parts and is considered a solid-state LiDAR.
Scanning LiDAR

Figure 14. A diagram showing the scanning functionality of a single point scanning LiDAR.
A scanning LiDAR sensor, as the name implies, uses focused points of lasers to illuminate single points within its view by pulsing light. The points of illumination are then shifted through the environment to gather distance readings for each point that is illuminated. Because only a single point needs to be illuminated and moved about the environment, the energy required for illumination over large distances is smaller as compared to divergent beam LiDARs.
Since LiDAR is a relatively new modality and is currently being improved by various groups of people, there are many methods of designing such a sensor (example). To accomplish the scanning capability, there are multiple methods:
(Traditional) A stationary enclosure with limited FOV where large mirrors are used to redirect the laser(s) on each axis.
(Traditional) A rotating enclosure to capture 360 degrees of data in a specific axis.
(MEMS) A stationary enclosure with limited FOV where many very tiny mirrors (1-7mm) are used to redirect the laser.
(Optical Phased Array) A stationary enclosure with limited FOV and an optical phased array of lasers.
Of each of the methods mentioned above, option 4 is the only scanning LiDAR that is considered solid-state where option 3 is considered quasi-solid-state. While scanning LiDARs may contain moving parts, solid state LiDARs accomplish the same feat with no moving parts.
One thing worth noting is that each LiDAR device will have its unique way of scanning the environment. The laser may be directed in a specific pattern for example spiraling around the environment or potentially scanning linearly back and forth across its field of view. Take the Livox Avia for example which uses a non-repeating spiraling pattern in an attempt to not miss out on any important features.

A quick illustration of the main forms of scanning LiDAR are included below.
Spinning LiDAR
Categories: Mechanical, Focused Point

Figure 16. An illustration of a spinning LiDAR device.
Spinning LiDAR uses a stationary base and rotating top to achieve a horizontal 360 degree view of its surroundings. Either a tilting mirror (Figure 16) is used to grant a limited vertical FOV or multiple laser channels (Figure 17). This type of scanning LiDAR typically covers a larger FOV than solid state LiDAR.

Figure 17. A GIF showing many lasers stacked and rotating inside of the enclosure of a scanning LiDAR device.
Source: https://www.hesaitech.com/things-you-need-to-know-about-lidar-the-more-lasers-the-better/
As mentioned previously, a spinning LIDAR can also be in the form of spinning/nodding a 2D LiDAR to cover a 3D Area.
Quasi-Solid-State LiDAR
Categories: Solid State*, Focused Point
Quasi-solid-state LiDAR uses Micro Electro-Mechanical Systems (MEMS) to accomplish the scanning capability.
In simpler terms, a MEMS will use micro-mirrors to directionally control the emission of light to the environment. *This minor movement of mirrors is a good compromise between the spinning of traditional scanning LiDARs while not losing as much light through dispersion as divergent based LiDAR.

Figure 18. A MEMS with micro-mirrors.
Source: https://www.sciencedirect.com/topics/engineering/digital-micromirror-device
An example of this type of LiDAR is the Intel Realsense L515. This LiDAR is susceptible to oversaturation of reflected light at the sensor.
Optical Phased Array LiDAR
Categories: Solid State, Focused Point
Optical phased array LiDAR is a solid state LiDAR that uses optical phased arrays to accomplish the scanning capability.
In simpler terms, an optical phased array emits light in different phases across its multiple emitters. This causes a concentration of light at a desired angle. This light is not divergent and is focused to a point by using the correct lenses.

Figure 19. An optical phased array projecting a signal at an angle.
In general, by using these technologies to emit light at specific angles, solid-state LiDAR accomplishes scanning an environment and distance mapping while containing no moving parts. Solid state LiDAR is allowing for increasingly smaller and cheaper LiDAR solutions as well.
BONUS: 4D LiDAR
4D LiDAR is labeled as such since other than distance data, you can also observe the velocity of each object.
Frequency-Modulated Continuous Wave (FMCW)
Phillip Sandborn from UC Berkeley explains that FMCW LiDAR is a chirped LiDAR whereby the [frequency] of the light source is modulated. The emitted and received chirps are superimposed on a photodiode and analyzed to produce a range and velocity reading. The velocity reading is observed through the application of the doppler effect.

Figure 20. The chirped signals and its response are compared to determine the range between the laser and the object.

Figure 21. A comparison of the space between the ramp-up and ramp-down of each signal helps us determine the doppler shift and therefore the velocity of the object.
Bridgerton Photonics’ white paper explains the equations that they use to get range & distance readings in their FMCW LiDAR sensor. They also mention that with FMCW LiDAR we can expect:
Improved dynamic range
Reflectivity doesn’t affect readings as much
Sunlight has less of an effect on readings (source)
Improved resolutions
Detecting surfaces with different finishes that are closely spaced
Improved ranges
Aeries II boasts 500m with 1550nm FMCW LiDAR
Velocity Estimation
This excludes objects that are laterally in motion to the LiDAR
For further reading, ThinkAutonomous.ai has a great writeup on FMCW. Additionally, Tangram Vision has a detailed write up on LiDAR with many examples of LiDAR sensors that are produced by various companies.
Limitations of LiDAR
Divergent Beam 3D LiDAR requires a significant amount of power to illuminate longer ranges and therefore usually operates within a limited range if using wavelengths other than 960 nm.
The sun emits some light in the same wavelength as LiDARs and can easily wash out the illumination produced from a divergent beam LiDAR making outdoor data less reliable than indoors during the day. However with 1550 nm FCMW LiDAR, there is less interference.
LiDAR does not permeate through walls, fog and heavy rain as radar might. LiDAR however will see through glass while radar will not.
Mechanically scanning LiDAR is susceptible to perturbations (perhaps caused by bumpy roads or a vibrating airplane). Solid state LiDAR is much less susceptible.
Non-mechanical LiDAR solutions (such as divergent beam LiDAR) are limited in their angular range (180 degrees for some, limited, consumer LiDAR solutions) while some scanning LiDARs can capture 360 degree data.
FMCW LiDAR can use a significant amount of power.
FMCW LiDAR can only determine the velocity of objects moving towards or away from the sensor, not of objects moving laterally to the sensor.
The weight and power requirements of a LiDAR device may affect whether it can be used on your project. While the Livox Avia is only roughly 500g, LiDAR devices can quickly reach weights of 900g, like the Zenmuse L2, with a power requirement that maxes out at 58 W. These weight and power requirements need to be monitored carefully when selecting a LiDAR device for your project.
Conclusion
LiDAR is a prominent emerging technology with various applications. It is versatile in its applications and constantly being iterated and improved upon. The various types of LiDAR each have drawbacks and benefits that can be used to make decisions when deciding the type of LiDAR to use for a project. You may think that a scanning LiDAR would not be able to detect power lines due to its nature of gathering thousands of miniscule points of depth from large distances, however, there are many integrated scanning LiDAR solutions that can detect power lines such as the Rock R2A (video example) which uses the Livox Avia.
Date Last Edited: Jan 30, 2024
If you are developing a new robotics, drone, or automation project and are considering LiDAR or other sensor technologies, feel free to reach out to Virtana at info@virtanatech.com for a free consultation and to explore possible ways that Virtana can help you meet your project goals.
If you’ve read this whole article and still aren’t satisfied, Cihan Altultas has a detailed write up on a Review of Scanning and Pixel Array-Based LiDAR Point-Cloud Measurement Techniques to Capture 3D Shape or Motion. It is worth a read.
We’re hiring! Consider applying to one of our available positions on the career page.